


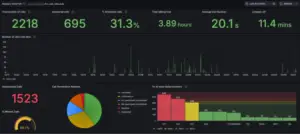
 When managing a business communication system, applying 3CX Grafana SQL monitoring is a crucial solution for making sure your VoIP server stays stable. By using advanced data visualization, the integration between the SQL database and the Grafana dashboard lets the IT team monitor 3CX performance in depth and in real time.
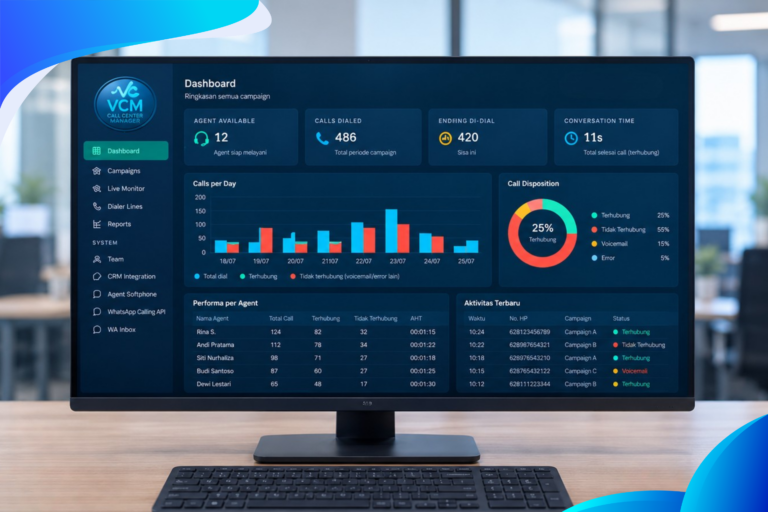
By integrating 3CX, an SQL Database, and a Grafana Dashboard, companies can gain deep insight into call center performance, agent activity, and customer service quality, all in one visual display that is easy to understand.
What Is 3CX?
3CX is an IP-based PBX (Private Branch Exchange) system that enables voice, video, and chat communication over the internet.
Its main features include:
-
SIP-based internal & external calls
-
CRM integration and the WhatsApp Business API
-
Queue management and call reports
-
Support for on-premise and cloud systems
However, the built-in 3CX reports are sometimes limited. This is where SQL and Grafana become a powerful solution.
Why Do You Need an SQL Database?
By default, 3CX stores call activity data in a database (PostgreSQL or MySQL depending on the version).
This data includes:
-
Inbound & outbound call history
-
Waiting time
-
Conversation duration
-
Agent status (available, away, busy)
-
Queue data
By accessing this SQL database, companies can perform custom analysis and build reports that are more flexible than those provided by the built-in 3CX dashboard.
Why Use Grafana?
Grafana is an open-source data visualization platform that is very well suited to displaying metrics in real time.
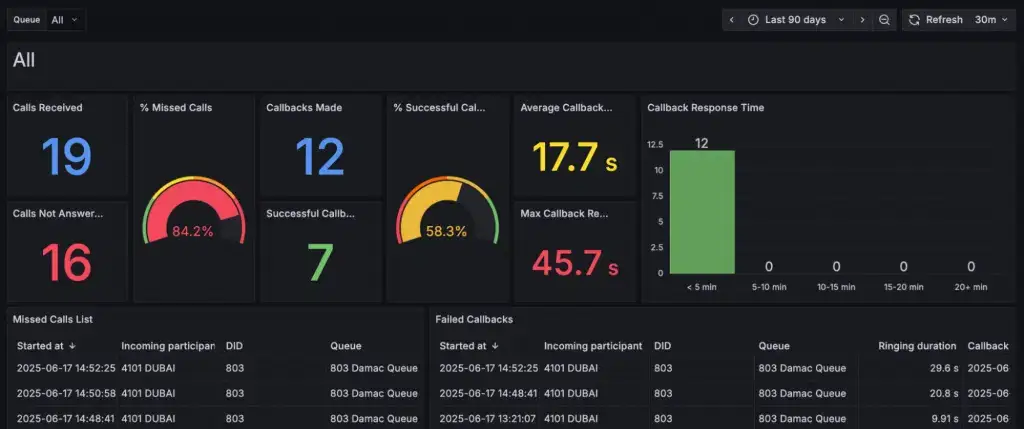
By connecting Grafana to the 3CX SQL database, you can create dynamic dashboards containing charts, tables, and key performance indicators (KPIs).
Some examples of panels you can create:
-
Number of incoming calls per hour
-
Average customer wait time
-
Missed call rate
-
Agent performance (calls handled per agent)
-
System availability and uptime
All of this can be displayed in interactive charts that help the operations team make quick decisions.
Benefits of Implementing 3CX Grafana SQL Monitoring for customer service
| Need | Solution |
|---|---|
| See agent performance | A “Top Performing Agents” panel with resolved-call metrics |
| Monitor call traffic | A chart of call volume over time |
| Detect queue problems | Wait time and missed call metrics |
| Analyze campaign performance | Comparison of outbound calls per campaign |
| Automatic reports to management | Dashboards can be sent automatically by email |
Benefits of Implementing 3CX Grafana SQL Monitoring for telemarketing
| Telemarketing Need | Solution |
| Monitor the number of daily calls per agent | The dashboard shows total incoming & outgoing calls in real time from the 3CX database |
| See the ratio of connected vs failed calls | A “Call Success Ratio” panel shows the comparison between successful, unanswered, and failed calls |
| Analyze the performance of a campaign or promotional script | SQL queries can be filtered by campaign ID, time, or outcome to evaluate results |
| Measure the average conversation duration | An “Average Talk Time” panel shows the average conversation length per agent or per campaign |
| Know the most effective calling hours | Grafana shows a heatmap of call volume per hour to determine the best time to contact customers |
| Control agent status and activity | A panel shows each agent’s login status, breaks, and active time based on real-time data |
| Identify high- or low-performing agents | A ranking dashboard shows per-agent performance from total calls and conversion results |
| Create automatic reports for management | Grafana can schedule daily or weekly reports by email |
| Improve team motivation and transparency | A real-time dashboard can be displayed in the workspace as a performance wallboard |
| Provide historical data for evaluation | SQL stores the entire call history, which can be processed for long-term trend analysis |
Benefits for the Company
-
Operational Transparency
-
All call data and agent performance are clearly visible in one dashboard.
-
-
Faster Decision Making
-
Managers can immediately spot bottlenecks and allocate resources more efficiently.
-
-
Improved Agent Productivity
-
With real-time monitoring, agents are more motivated to maintain performance.
-
-
Improved Customer Service Quality
-
Wait times can be minimized, and customers feel more satisfied with fast responses.
-
-
Low Cost, Open-Source Technology
-
Grafana and SQL are open source and can be self-managed.
-